Solar Power for Home Cost in 2026: What Homeowners Should Expect
Explore real-world costs for residential solar panels, including upfront ranges, incentives, financing options, and payback timelines to plan your home solar project.

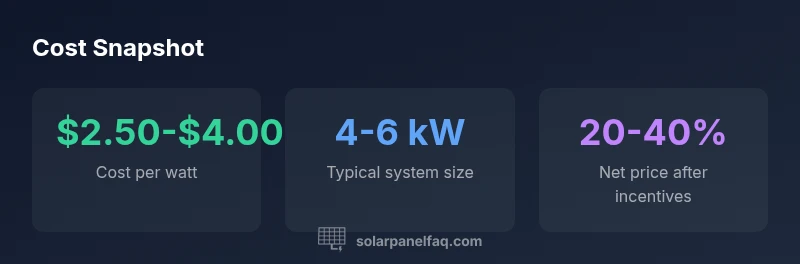
Solar power for home cost typically falls in the range of $2.50 to $4.00 per watt before incentives, translating to about $10,000 to $25,000 for a typical 4-6 kW system in 2026. Net price after federal incentives and financing can drop by roughly 20% to 40%, depending on location, roof type, and energy needs. These figures come from Solar Panel FAQ Analysis, 2026.
Why solar power cost for home matters
According to Solar Panel FAQ, the cost of solar power for a home is more than just the sticker price on panels. Homeowners must assess the full lifecycle value, including upfront hardware, installation, permitting, and ongoing maintenance, alongside long-term energy savings. In 2026, market dynamics—availability of panels, inflation in construction costs, and policy incentives—continue to shape what households actually pay. The Solar Panel FAQ team finds that most buyers who look beyond the initial quote end up with a clearer picture of total ownership costs, the timing of payback, and how different financing choices affect monthly bills. When you plan, consider not only the lowest cost per watt but also reliability, warranty terms, and the system’s ability to scale with future needs.
- Upfront costs cover hardware (panels, inverter, racking), installation labor, and permitting. These elements vary by roof type, orientation, and local regulations.
- Ongoing costs include monitoring, inverter life, and occasional panel cleaning. These are typically small relative to the upfront outlay but can affect long-term value.
- Comparisons across regions should account for climate, solar irradiance, and utility rate structures, which influence how quickly you recoup your investment.
How costs are driven: key variables that move the number
Cost variability for residential solar hinges on several core drivers. System size and panel efficiency are the most visible factors: larger systems and higher-efficiency modules produce more electricity but cost more upfront. Roof type and condition influence installation complexity; labor costs rise with difficult angles, mounting on tile roofs, or constrained attic access. Geographic location matters due to permitting rules, sales tax, and transport costs, but also due to sunlight exposure and local electricity prices, which affect potential savings.
Solar hardware choices add another layer: string inverters are typically cheaper upfront than microinverters or power optimizers, but may reduce performance in shaded or complex roof layouts. Balance-of-system components—racking, wiring, wiring conduits, and monitoring equipment—also contribute to the total cost. Finally, project management and permitting fees vary by city and county. Understanding these drivers helps homeowners evaluate quotes consistently and avoid surprise costs at sign-off.
Financing options and incentives that influence net cost
Financing can dramatically alter the bottom line. Many homeowners choose cash purchases to maximize long-term savings, while others prefer loans or leases to spread out the cost. A loan keeps ownership and tax credits; a lease or PPA may render lower or zero upfront costs but transfers some benefits to the financier. Federal and state incentives reduce the net cost, with policy variability across states and over time. As of 2026, incentives commonly reduce upfront outlay by a meaningful percentage, though exact amounts depend on filing status, system size, and eligible credits.
Before committing, map out several scenarios: cash purchase, solar loan, and a lease/PPA. Compare not only the upfront price but the total cost of ownership over 15–25 years, the assumed rate of electricity price growth, maintenance needs, and any performance guarantees. A careful comparison helps ensure you pick the option that aligns with your budget and energy goals.
Regional and roof considerations that affect cost and value
Regional differences substantially affect both cost and value. Regions with high electricity costs and strong solar incentives tend to offer shorter payback periods and higher net savings. Sun exposure—measured as peak sun hours per day—directly impacts how much energy your system can generate, influencing system size and economic return. Roof orientation and shading from nearby trees or structures can reduce production, prompting a larger system size or choice of higher-efficiency modules.
Roof type matters: asphalt shingle roofs are usually easier and cheaper to install than tile or metal roofs, which may require specialized mounting and repair. Ventilation, shading from chimney stacks, or vent pipes can complicate installation and drive costs up slightly. Local permitting rules and HOA restrictions may add to soft costs. Finally, interconnection policies and net metering terms affect how quickly you’ll see value from the energy you produce.
Estimating system size and cost for your home
Estimating the right system size starts with your current electricity usage and future plans. Homeowners often begin by reviewing annual kWh consumption from recent utility bills and then adjusting for planned efficiency improvements or expansions (electric vehicle charging, pool heating, etc.). A rule of thumb for many homes is 4–6 kW, but larger family homes or properties with high energy use could require 7–10 kW or more to meet most needs. The cost scales with size, but not perfectly, because some fixed costs (permits, design, and certain labor elements) do not vary linearly.
To translate size into price, multiply the expected system wattage by a typical cost per watt in your region. Since prices fluctuate over time and by vendor, use a range rather than a single figure. Then apply likely incentives and potential financing terms to estimate your net amount. If you’re unsure, obtain quotes from multiple reputable installers who disclose all line items and provide a clear breakdown of the warranty terms and expected performance over 25 years.
Real-world scenarios: 3 homeowner profiles and payback outlook
- Small home in a sunny climate (4 kW system): Upfront range often near the lower end of the per-watt spectrum; payback can occur in roughly 7–12 years depending on local electricity rates and incentives. Long-term savings accrue as utility rates rise and system performance remains near the expected range.
- Family with higher energy usage (6 kW system): Higher upfront cost, but improved economies of scale can shorten the payback period toward the 6–10 year window in favorable regions. A well-timed battery add-on can further reduce grid dependence in some policies.
- Home in a high-cost electricity region with strong incentives (8 kW system): Although the initial price is higher, robust incentives and higher electricity prices can push payback under 10 years. If the homeowner plans to stay long-term, the overall value edge increases with system longevity and warranty coverage.
How to shop smart and avoid common cost traps
- Gather detailed quotes from at least three installers and insist on a complete Scope of Work including all BOS components, warranty terms, and expected performance.
- Check the module and inverter warranties, ensuring coverage aligns with your expected system lifetime; understand what voids warranty and whether roof replacement affects coverage.
- Be wary of unexpectedly low bids; ensure the proposal includes all permit fees, taxes, and interconnection charges, and verify that shading analysis or production estimates are realistic.
- Consider future needs and potential expansions; if you’re planning an EV, ensure your system can scale or plan a staged upgrade.
- Leverage reputable financing, monitor ongoing energy usage, and confirm whether net metering terms are favorable for your property and utility policy.
In short, a careful, comparison-driven approach backed by credible data helps you optimize the total cost of ownership and maximize long-term value.
The Solar Panel FAQ perspective and credible sources
From the Solar Panel FAQ perspective, credible cost analysis combines upfront quotes with long-term energy savings, credible incentives, and policy stability. The team emphasizes that homeowners should view cost as a multifaceted decision, not a one-time price. Solar investments become more compelling when informed by transparent quotes, verified performance estimates, and a realistic payback timeline. For readers seeking more information, consult authoritative sources and the installers’ performance simulations. Solar Panel FAQ analysis, 2026, reinforces the importance of a holistic view over simply chasing the lowest upfront price.
Estimated cost components for residential solar installation
| Component | Cost Range (before incentives) | Notes |
|---|---|---|
| Panels | $0.80-$1.50 per watt | Depends on technology and efficiency |
| Inverter | $0.15-$0.40 per watt | String vs micro inverters vary by roof layout |
| Racking & BOS | $0.50-$1.50 per watt | Includes mounting hardware and wiring |
| Installation Labor | 3-6% of total cost | Site complexity influences labor |
| Permitting & Design | 1-3% of total cost | Local requirements and HOA rules |
Frequently Asked Questions
What is the typical upfront cost range for a 5 kW solar system?
A 5 kW system generally falls within a broad range of upfront costs depending on location, equipment, and labor. Typical quotes may fall near the lower to mid-per-watt range before incentives, with variations driven by panel efficiency, inverter type, and mounting complexity.
A 5 kW system usually costs between the low and mid range per watt before incentives, depending on your region and installer choices.
How long does it take to recover the cost through savings?
Payback periods vary by region and electricity prices but commonly range from about 6 to 12 years before incentives, with shorter timelines where incentives are stronger and electricity costs are high.
Most homes see payback in roughly 6 to 12 years, depending on incentives and local energy costs.
Do federal or state incentives still apply in 2026?
Yes, federal incentives typically apply, and many states offer additional programs. The availability and size of incentives can change annually, so confirm current eligibility and step-by-step filing guidance with credible installers.
Incentives are still available in many places, but check current programs with trusted installers.
Does roof type affect the cost?
Roof type and condition influence installation complexity and cost. Tile or metal roofs can raise labor and mounting costs, while asphalt shingles are generally easier and cheaper to work with.
Yes—roof type affects installation cost and time.
What financing options exist beyond paying upfront?
Beyond cash purchases, loans and leases/PPA agreements are common. Loans keep ownership and credits, while leases/PPA can reduce upfront costs but may limit long-term benefits.
There are loan, lease, and PPA options you can compare.
Are ongoing maintenance costs significant?
Maintenance costs are typically modest but can include inverter replacements, occasional cleaning, and monitoring. These costs are usually small relative to upfront investment but contribute to long-term value.
Maintenance costs exist but are generally small compared to upfront costs.
“Understanding the true cost of solar power for home cost means looking beyond the sticker price to long-term value, financing, and local policy. When you factor incentives and energy savings, many households reach payback within a decade.”
Top Takeaways
- Assess total cost of ownership, not just price per watt
- Factor incentives and financing into your net cost
- Expect regional variation in payback timelines
- Choose installers with transparent, itemized quotes
- Plan for future needs like EV charging or battery storage