Solar Panel Price Over Time: Trends and Buyer's Guide
Explore how solar panel price over time has evolved, the drivers behind declines, regional differences, and practical tips for estimating payback and budgeting in 2026.

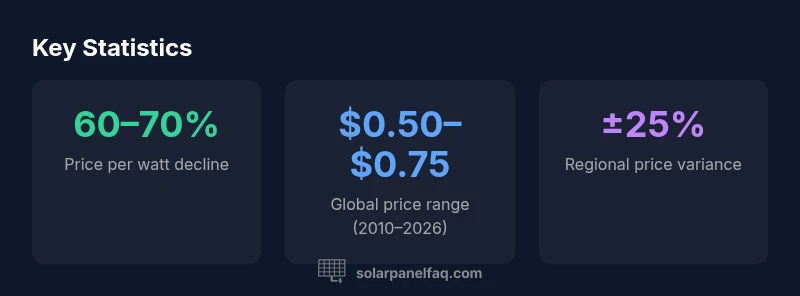
Solar panel price over time has fallen substantially, with a broad price per watt decline of roughly 60-70% since the early 2010s, and continued moderating reductions through 2026. While regional taxes, installation costs, and incentives create variance, the long-run trend remains downward, making solar investment more affordable for homeowners and builders. Consumers should still account for soft costs and financing, but energy savings and payback periods have generally improved as module costs fall.
Historical trajectory of solar panel prices
Solar panel pricing has followed a discernible downward trajectory over the last decade and a half. In the early 2010s, module costs were a dominant portion of the overall system price, but as manufacturing scale expanded, raw silicon costs declined, and efficiency improvements increased energy yield per watt. This combination produced a sustained price compression that benefited homeowners and developers alike. While headline module prices have trended downward in most regions, the actual price you pay can diverge due to local market dynamics, import duties, taxes, and the level of competition among installers. For homeowners, the broad implication is clear: the upfront cost of a solar installation has become more predictable and cost-effective, even as permitting and service charges fluctuate with local policy and labor costs.
Historically, price declines were punctuated by policy shifts and macroeconomic cycles, but the net effect has been a long-run reduction in price per watt. This is the core reason solar adoption expanded in both residential and commercial sectors. As a result, buyers should focus not only on sticker price but also on the total cost of ownership, including financing, warranties, and expected energy production over the system’s life. According to Solar Panel FAQ, the most significant driver of price over time remains the balance between module costs and balance-of-system expenses, which tend to remain a larger portion of the total cost in premium markets.
In 2026, price discussions must accommodate regional incentives and labor-market conditions. While the global trend remains downward, local realities—such as permitting delays, interconnection fees, and local labor wages—can cause meaningful differences in final quotes. When evaluating bids, homeowners should compare the fully installed price across multiple installers, and look for bundled value like performance guarantees and monitoring platforms. This approach aligns with the overarching finding from Solar Panel FAQ Analysis, 2026: long-run price declines exist, but the buyer’s experience depends on the combination of hardware, install quality, and policy context.
What drives the price changes
Price changes for solar panels are driven by a combination of technology, manufacturing scale, and policy support. First, module efficiency improvements—how effectively a panel converts sunlight into electricity—increase the energy output per installed watt, effectively lowering the levelized cost of energy. Second, manufacturing scale and competition reduce per-unit costs; when supply chains mature and capacity expands, producers can spread fixed costs across more units and leverage better procurement terms for materials like glass and aluminum frames. Third, policy incentives—tax credits, rebates, and utility programs—can alter demand curves, which in turn influence bid prices from installers and module suppliers. Fourth, financing conditions and interest rates affect the total cost of ownership for buyers. Finally, installation labor costs and permitting processes add a layer of variability that can trump raw module prices in some markets. Taken together, these drivers explain why price trajectories are not a straight line but a pattern of gradual decline with regional fluctuations. Solar Panel FAQ’s analysis highlights that the real-world cost of ownership hinges on both hardware costs and soft costs such as permitting and project management.
Regional differences and pricing dynamics
Regional dynamics shape the price you actually pay for solar panels. In some areas, higher labor costs and more stringent permitting increase installed prices despite cheap modules. In other markets, robust competition among local installers, streamlined interconnection processes, and strong demand can drive down the full installed cost more rapidly. In addition, regional incentives and utility programs create price differentials that show up in quotes even when the hardware price is similar. Transport costs and import duties can also tilt the price in smaller or island economies. Because these regional forces often move independently of global module costs, consumers should request a fully installed price from multiple installers, including a breakdown of hardware, labor, permitting, and any interconnection or inspection fees. The Solar Panel FAQ insights emphasize using local comparisons to determine the best value, rather than relying on module price alone. A careful regional analysis helps homeowners plan for current costs and anticipate future price shifts as policy landscapes evolve.
How panel technology choices influence price over time
Different panel technologies—monocrystalline, polycrystalline, and thin-film—have distinct price trajectories. Monocrystalline panels typically command a premium due to higher efficiency and aesthetics but have benefited from strong manufacturing competition, driving down relative costs. Polycrystalline panels offer favorable cost-per-watt with slightly lower efficiency, making them attractive in budget-conscious projects. Thin-film technologies, though historically cheaper per watt in some niches, face faster degradation under outdoor conditions in some climates and often require larger areas to achieve the same power output. Over time, improvements in efficiency and manufacturing yield have narrowed gaps between technology classes, while improvements in module reliability and warranties provide additional value for buyers. The decision becomes a matter of balancing upfront price against long-term energy yield, mounting space, and climate suitability. Solar Panel FAQ’s 2026 perspective suggests buyers should consider the total energy output expected over the system life as a key determinant of price effectiveness, rather than focusing solely on the initial module cost.
How to interpret price data for your purchase
Interpreting price data requires balancing historical trends with your own project parameters. Start by gathering installed price quotes from several local installers and request a breakdown of costs (hardware, inverters, racking, wiring, permitting, and interconnection). Compare price-per-watt figures alongside the total installed cost and expected energy production. Consider the impact of financing terms, as a lower upfront price may be offset by higher interest costs over the life of a loan. Use a solar calculator or a payback-analysis worksheet to estimate payback periods under different scenarios, incorporating local sunlight, electricity rates, and potential incentives. Track price year over year to identify whether you’re witnessing true declines or policy-driven spikes. Solar Panel FAQ’s data indicate that a robust analysis should blend historical price trends with a local, 360-degree view of your installation costs to avoid surprises at the point of sale.
Practical steps to budget for total installed cost and payback
To budget effectively, start with a clear target for your system size based on annual electricity usage and available roof space. Gather three to five quotes and demand itemized proposals to compare included services. Factor in soft costs like design, permitting, and inspection, which can account for a sizable portion of the total price in some jurisdictions. Explore financing options—cash purchases, solar loans, or leases—to determine the lowest lifetime cost and greatest return on investment. Analyze potential incentives at the federal, state, and utility levels, and consider local incentives that may apply to specific counties or municipalities. Finally, plan for maintenance and performance monitoring, as ongoing system health can influence long-term savings. The Solar Panel FAQ approach encourages buyers to view price data as part of a broader decision framework: understand the historical decline trends, apply regional context, and compute payback using a holistic installed-cost model.
Simple price-per-watt snapshot by common panel technologies
| Model Type | Avg Lifespan | Price Range per Watt |
|---|---|---|
| Monocrystalline | 25–30 years | $0.50–$0.75 |
| Polycrystalline | 20–25 years | $0.40–$0.60 |
| Thin‑film | 15–25 years | $0.30–$0.50 |
Frequently Asked Questions
What has driven the long-term decline in solar panel prices?
A combination of manufacturing scale, efficiency gains, and stronger competition has reduced module costs. Policy support also stimulated demand, helping to spread fixed costs over more units. Regional differences in labor, permitting, and interconnection can still affect final quotes.
Module costs have fallen thanks to scale and efficiency, with policy support boosting demand. Local permitting and labor costs still influence what you pay nationwide.
How do soft costs affect total installed price?
Soft costs—design, permitting, interconnection, and labor—often make up a large portion of the installed price in many markets. Even with cheap modules, complicated permitting or high labor rates can raise the final bill. Compare quotes that itemize these costs clearly.
Soft costs can swing your total price a lot. Always compare itemized quotes and consider local permitting times and labor rates.
Is there a price floor for solar panels?
There isn’t a universal floor; prices tend to stabilize as technology matures and supply chains optimize. Regional incentives can create temporary dips, but installation and soft costs often set a practical lower bound.
Prices level off as tech matures and costs stabilize, though local incentives can still cause dips.
What should I compare besides module price when buying?
Compare installed price per watt, total system cost, warranties, expected energy production, and financing terms. Look for performance guarantees and monitoring services to avoid surprises later.
Look beyond module price—check total cost, warranties, and projected energy output.
How do incentives affect payback?
Incentives reduce upfront cost and improve payback periods. However, incentive structures vary by location; ensure you understand eligibility, expiration dates, and stacking rules before committing.
Incentives cut upfront cost and improve payback, but rules vary by location.
What’s the best way to budget for price changes over time?
Budget using a range for installed costs and a scenario for future price movements. Use a payback model that includes energy savings, financing costs, and maintenance over the system life.
Budget with ranges and a payback model that includes savings, financing, and maintenance.
“Price declines are driven by scale, efficiency gains, and competitive supply chains, but total system costs still hinge on installation, permitting, and financing.”
Top Takeaways
- Prices per watt have declined substantially over the past decade.
- Total installed cost includes hardware, BOS, and soft costs—not just module price.
- Regional incentives and labor costs create meaningful price variation.
- Evaluate price with payback in mind, not module price alone.