How Much Do Solar Panels Cut Electricity Bills in 2026
Discover how much solar panels can reduce your electricity bills, with practical ranges, key factors, payback timelines, and actionable steps to maximize savings for homeowners in 2026.

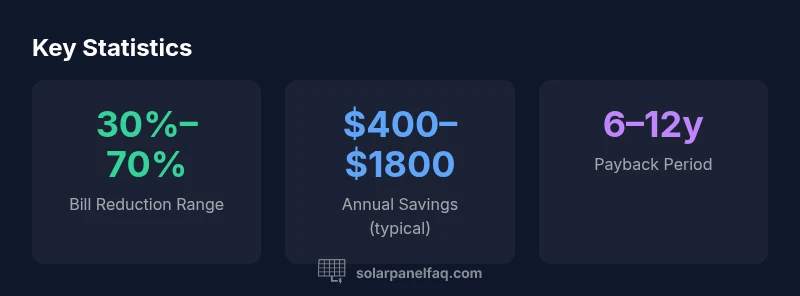
Solar panels typically reduce a home's electricity bill by a substantial margin, often around 30%–70%, depending on system size, roof orientation, shading, energy usage, and local utility rates. In many cases, homeowners see annual savings of hundreds to thousands of dollars, with a payback period commonly ranging from six to twelve years under standard incentives.
Understanding the Savings Landscape
When homeowners ask how much does solar panels reduce electricity bills, the answer depends on several interrelated factors. The size of your system relative to your annual energy usage, the amount of sun your site receives, and how your utility structures rates all play a crucial role. The more solar energy you generate during peak-price periods and the more you avoid buying grid power, the larger your bill reduction will be. Local incentives, net metering policies, and potential tax credits can further improve the bottom line. This section explains how to translate solar production into real-dollar savings, and why two houses with similar solar arrays can experience very different bill outcomes.
For context, consider that a well-sized solar installation in a sunny climate can produce a substantial portion of a home's annual electricity needs. Yet the exact savings depend on your energy consumption habits and how you are compensated for excess generation by your utility. By understanding the interactions among system efficiency, utility rate design, and household usage, you can set realistic expectations and plan the investment with greater confidence.
Key drivers of savings
Savings from solar are driven by several core factors:
- System size and production: A larger system that matches or slightly exceeds annual usage will typically yield higher bill reductions. Production depends on your roof’s orientation, shading, and tilt, as well as panel efficiency and inverter performance.
- Electricity rates: Higher per-kWh rates magnify the value of solar production. Utilities may offer different rate tiers, Time-of-Use (TOU) schedules, and demand charges that influence savings. TOU can substantially boost savings if you shift usage to daytime hours when solar is producing at peak levels.
- Net metering and compensation: If your utility allows net metering or a favorable buyback rate, you earn credits for excess generation, directly reducing bills in months with low solar output.
- Usage patterns: Homes with high daytime electricity use (e.g., running appliances, EV charging during the day) tend to maximize solar value. Conversely, if most consumption occurs at night, savings may be more modest unless paired with storage or TOU optimization.
- Incentives and financing: Tax credits, rebates, and favorable financing terms reduce upfront cost and improve the effective payback period. The availability and amount of incentives can shift the economics notably.
How to estimate your savings: a practical approach
Estimating solar savings involves a simple, repeatable process you can do with a few data points. First, gather your last 12–24 months of electricity consumption and your current electricity rate. Next, select a system size that aligns with your annual usage, typically expressed in kilowatts (kW). Then, use a reputable solar calculator or consult a local installer to estimate annual production in kWh. Subtract expected annual production from your total demand to gauge the portion of usage that will be covered by solar. Finally, multiply the projected solar production by your per-kWh rate (adjust for any net metering credits) to estimate annual bill reductions. If you face TOU pricing, model savings by time segments to capture peak-hour value. This method yields a pragmatic range rather than a single fixed number, reflecting real-world variability.
Scenarios by location and rate structure
Solar savings are highly context-dependent. In regions with high electricity costs and generous incentives, a mid-sized system can cover a larger share of annual energy needs, yielding significant bill reductions. In locations with lower rates or limited sun exposure, the same system could deliver smaller savings. Net metering policies and TOU rate structures further shape outcomes. A clean rule of thumb is that higher rates and stronger compensation for daytime production tend to produce greater bill reductions. Always compare your local utility’s tariff plans and incentive programs when projecting savings.
Common pitfalls and how to avoid them
Some homeowners overestimate savings by assuming perfect conditions year-round or by using optimistic production estimates. Others underestimate the impact of rising electricity prices over the investment horizon. To avoid over- or under-optimizing, use conservative assumptions, validate production with multiple calculators, and consider a post-installation performance monitoring plan with your installer. Monitoring helps detect production shortfalls early and ensures your system performs close to the expected range.
Maximizing savings: practical actions
- Size the system to closely match annual consumption, not just peak demand. A properly sized system reduces the likelihood of oversizing or undersizing.
- Favor roof conditions with minimal shading and optimal orientation to maximize daytime production.
- Explore TOU tariffs if available, and align high-energy activities with daytime solar generation.
- Invest in a quality inverter and components with robust warranties to maximize long-term performance.
- Consider storage for time-shifted savings, especially in regions with high daytime generation but evening demand. Even if storage isn’t essential, it can improve resilience and cut demand charges in some setups.
Savings scenarios by usage and rate structure
| Scenario | Estimated Savings Range | Main Assumptions |
|---|---|---|
| Moderate Usage | 30%–50% | 5 kW system; mid-rate area; standard usage |
| High Usage / High Rates | 50%–70% | 6 kW system; TOU rates; sunny climate |
| Low Usage / Low Rates | 20%–40% | 4 kW system; conservative usage; lower rates |
Frequently Asked Questions
What is the typical range of electricity bill reduction with solar panels?
Most homeowners see a meaningful decrease in their electric bill, typically within a 30%–70% range, depending on system size, local rates, and usage. Individual results vary, but planning around conservative projections helps manage expectations.
Most homes see a sizable drop—usually between 30% and 70%—but it depends on your system and rates.
Is net metering required to maximize solar savings?
Net metering or favorable crediting is often a key part of maximizing savings, as it credits excess daytime generation against your grid consumption. If your utility lacks net metering, the savings will still exist but may be smaller.
Net metering helps you get the most out of daytime solar generation.
Can solar save money in cloudy or winter climates?
Yes, solar still saves money in less sunny climates, but production is lower and savings are smaller. Performance depends on panel efficiency, roof orientation, and seasonal weather patterns.
Solar still saves, just at a smaller scale in cloudy or shorter-day months.
Do I need a battery storage system to maximize savings?
Battery storage can shift daytime production to evenings and may improve savings, especially with TOU pricing or high evening demand. It adds cost, so weigh payback against energy needs and incentives.
Batteries can boost savings, but they add cost and complexity.
How do incentives affect savings and payback?
Incentives like tax credits or rebates reduce upfront cost and shorten the payback period. Availability and amount vary by year and jurisdiction, so check current programs before deciding.
Incentives make solar more affordable and can shorten payback a lot.
What ongoing costs should I expect after installation?
Ongoing costs are typically limited to maintenance, possible inverter replacement, and occasional cleaning. Most systems carry long warranties, and many components require minimal upkeep.
Maintenance is usually minimal; most systems need little ongoing attention.
“Accurate sizing and local incentives are the keys to translating solar production into meaningful bill reductions.”
Top Takeaways
- Understand that savings vary by location and usage
- Size and orientation matter more than you might expect
- Net metering and TOU pricing can dramatically affect outcomes
- Use conservative estimates when planning and verify with multiple calculators
- Pairing storage can boost daytime value and resilience