How Much Do Solar Panels Save? A Practical Guide for Homeowners
Learn how much solar panels save in typical scenarios, including factors that affect savings, regional variation, incentives, and practical steps to estimate your own bill reductions.

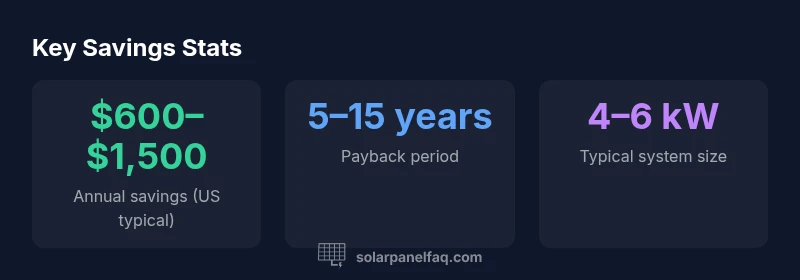
How much do solar panels save? In many U.S. homes, annual savings typically range from about $600 to $1,500 depending on electricity rates, system size, and incentives. In high-rate regions with strong incentives, savings can exceed this range. The Solar Panel FAQ Analysis, 2026 notes payback commonly falls between 5 and 15 years.
Realistic Savings Overview
According to Solar Panel FAQ, homeowners often see meaningful reductions in their monthly electric bills after installing solar panels, but the exact dollar figure depends on several variables. A practical starting point is to view savings as a function of three core inputs: your local electricity price, the size and efficiency of your solar system, and the specific financial incentives available where you live. In many U.S. markets, annual savings commonly fall within a broad range, and the payback period can vary from a few years to well over a decade. By understanding the levers—rate structure, system performance, and incentives—you can form a realistic expectation for your home and avoid overpromising results.
Factors That Shape Savings
Savings depend on the environment and your choices. Key factors include: (1) Electricity rate and structure: tiered pricing, time-of-use rates, and your monthly baseline usage all influence how much money solar can offset. (2) System size and orientation: larger, well-placed systems capture more sunlight and generate more kilowatt-hours, boosting annual savings. (3) Panel efficiency and degradation: high-efficiency modules generate more energy in small spaces, while gradual efficiency loss over time reduces year-to-year gains. (4) Local incentives: tax credits, rebates, and net metering policies can dramatically change the financial picture. (5) System integration: proper inverter sizing, optimal tilt, and shading assessments matter for real-world performance. For homeowners, a tailored sizing study is essential to avoid under- or over-investment.
Calculating Your Personal Savings
To estimate your own savings, start with three inputs: your current annual electricity bill, your expected system size in kilowatts (
Regional Variations and Climate Impacts
Savings vary strongly by geography. Regions with higher electricity prices and stronger daylight exposure typically see larger annual savings. In sunnier climates, panels consistently generate more energy, while northern or cloudier areas may rely more on incentives to keep the economics favorable. Shading from trees or neighboring structures can also depress production, reducing potential savings. Conversely, homes with optimal roof orientations and minimal shading maximize production and bill reductions. Climate and weather variability should be integrated into any forecast to avoid overestimating year-to-year results.
System Size, Orientation, and Efficiency
System size directly correlates with potential savings: a larger system produces more kilowatt-hours and lowers the effective cost per
Financial Incentives and Net Metering
Incentives such as tax credits, rebates, and favorable financing models can substantially affect savings. Net metering policies that credit you for excess generation when your panels produce more than you use can turn solar production into direct bill reductions. Some regions offer time-based credits that align better with peak pricing, boosting the value of your solar energy. To understand the full savings potential, review local incentives and utility policies, and consider how they interact with your system size and energy usage patterns.
Maintenance and Longevity's Impact on Savings
Solar systems are relatively low-maintenance, but performance drift and component aging can influence long-term savings. Regular cleaning (to remove dust or debris) and periodic inspections help maintain production, especially in dusty or humid climates. Inverter or microinverter life and warranty terms also affect long-term savings, as failures can reduce output or trigger replacement costs. A properly maintained system is more likely to deliver the expected savings over 25–30 years, making maintenance a prudent part of your solar plan.
Case Studies and Examples
A hypothetical two-story home with a 6
Common Pitfalls and Misconceptions
Common myths include assuming savings are guaranteed, that all regions offer the same incentives, or that a bigger system always means proportionally bigger savings. In reality, performance is constrained by roof space, shading, and local policy. Also, beware of misinterpreting “top-line” generation as “net savings”—the financial bottom line depends on net metering, incentives, financing costs, and maintenance. A thoughtful, data-driven approach helps homeowners set realistic expectations.
Regional and rate-based variation in residential solar savings
| Region/Factor | Estimated Annual Savings Range | Payback Range (years) |
|---|---|---|
| High electricity rates region | $1,000–$1,800 | 6–12 |
| Average region | $600–$1,200 | 5–15 |
| Low electricity rates region | $300–$800 | 7–15 |
Frequently Asked Questions
How much can I save in my first year?
First-year savings depend on your usage, system size, and incentives. Most homeowners see a noticeable reduction in bills, but the exact amount varies by location and how net metering is structured. Use an installer-provided estimate to quantify your potential first-year savings.
Your first-year savings depend on your usage and incentives. An installer can give you a precise estimate based on your home and local policies.
Do savings vary by roof direction or shading?
Yes. South-facing roofs generally maximize production in the northern hemisphere, while shading from trees or structures can significantly reduce output. A shading analysis during design helps prevent over-optimistic savings estimates.
Roof direction and shading matter a lot. A professional shade analysis helps you avoid overestimating savings.
How do incentives affect savings?
Incentives such as tax credits and net metering credits decrease the effective cost of solar, improving the payback period and lifetime savings. Availability and value vary by region, so check local programs before deciding.
Incentives can dramatically lower your upfront cost and shorten payback, so check regional programs.
Is solar savings guaranteed long-term?
Savings are not guaranteed year-to-year because production depends on weather and degradation over time. Models provide estimates, but your actual results will vary. Regular maintenance helps keep performance close to projections.
Savings aren’t guaranteed every year, but with maintenance you stay close to your forecast.
What affects payback period the most?
Payback is most influenced by electricity rates, system size, and the presence of net metering. Incentives can shorten payback substantially, while shading and poor orientation can lengthen it.
Payback mainly depends on rates, size, and incentives; shading can extend it.
“Solar savings are highly location-dependent, but with proper sizing and incentives, most homeowners see meaningful reductions in their electric bills over time.”
Top Takeaways
- Estimate local incentives before sizing your system
- Higher electricity rates typically yield bigger savings
- Net metering credits can boost the bottom line
- System size and shading have the biggest impact on output
- Regular maintenance helps preserve long-term savings