Do Solar Panels Pay for Themselves: A Practical Guide for 2026
Discover whether do solar panels pay for themselves. Learn costs, incentives, and how to estimate your payback with a practical calculator and real-world scenarios for homeowners.

Do Solar Panels Pay for Themselves?
Do solar panels pay for themselves? In many homes, the answer depends on upfront cost, system size, local electricity rates, and available incentives. This guide explains how to estimate your payback and why some homes recoup faster than others. According to Solar Panel FAQ, homeowners who align a system with high usage and favorable rate structures often see a meaningful return over the life of the system. The key is to model energy production and savings over time, not just the sticker price. We'll walk through the steps, share practical, real-world scenarios that reflect typical ranges, and provide a calculator to tailor the calculation to your address and usage. By understanding the math behind the claim, you can decide if solar makes sense for your budget and goals.
How Payback Works: Cost, Savings, and Time
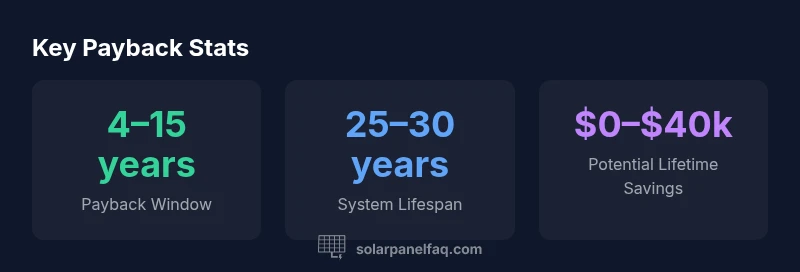
Solar payback hinges on three ideas: upfront cost, annual savings, and the lifetime of the system. Upfront cost scales with system size and local installation charges, typically expressed as cost per kW. Annual savings depend on how much energy the system produces and what you pay for electricity. The payback period can be estimated by dividing the total installed cost by annual savings. In many regions, incentives such as tax credits or rebates reduce the effective upfront, while net metering can boost annual savings by crediting excess generation. Solar Panel FAQ analysis shows that the payback window varies widely by location, utility rate, and incentive programs, but a well-matched system in a favorable policy environment often reaches break-even within a decade. Use the calculator to plug in your numbers and see where your roof stands on the spectrum. The more you align usage with generation, the faster the payback, and the more money you’ll save over 25–30 years.
Key Factors That Influence Payback
There are several levers that influence how quickly you recoup your investment:
- System size and orientation: Larger systems generate more energy, but oversizing can raise costs without proportional savings if your consumption doesn’t match production.
- Roof shading and angle: Even a modest amount of shade can drastically reduce annual production; aim for unobstructed sun during peak hours.
- Local electricity rates: Higher per-kWh prices increase the value of generated power, shortening the payback.
- Incentives and net metering rules: Tax credits, rebates, and how you credit excess energy can tilt payback in your favor.
- Information and maintenance: Regular cleaning and inverter replacement can influence long-term output. Solar Panel FAQ notes that understanding these levers helps homeowners set realistic expectations and plan for maintenance costs.
Regional Variation: Climate, Rates, and Incentives
Payback is not the same everywhere. Sunniest regions usually produce more kWh per kW, but installation costs may differ by market. Electricity rates vary by utility and state, and some areas have time-of-use rates that reward critical production windows. Incentive landscapes differ widely as well—federal credits, state programs, and utility rebates can dramatically shift payback timelines. Net metering policies determine how credits for excess generation are applied to future bills. Solar Panel FAQ guidance is to research your local policy landscape and run several calculator scenarios to compare how different incentive structures impact your payback.
Real-World Scenarios and Examples
Example A (typical market with modest incentives): A 6 kW system installed today might carry an upfront cost range of roughly $1,500–$3,000 per kW, for a total of about $9,000–$18,000 before any incentives. Annual production per kW commonly falls in the 900–1,600 kWh range, so the system could generate roughly 5,400–9,600 kWh per year. With electricity rates around $0.10–$0.25 per kWh, annual savings might span from about $540 to $2,400. In markets with limited incentives, payback tends to be longer, often stretching into a decade or more; in incentive-rich environments, it can be notably shorter. Always run multiple scenarios in the calculator to see where your roof sits on this spectrum.
Example B (strong incentives and favorable rates): In a policy-friendly area with higher rates and robust credits, the same 6 kW system may reduce upfront costs substantially and produce more favorable net metering credits. In such cases, payback timelines commonly shorten to the mid-teens, and many homeowners see meaningful ROI within the system’s lifetime. Remember that individual results depend on local programs and usage patterns.
Financing Options and Incentives
Beyond the upfront price, financing options can dramatically affect the apparent payback. Homeowners may access tax credits or rebates that reduce the effective cost, alongside loan programs with favorable interest rates. Net metering policies that credit excess generation toward future bills further improve annual savings. Some buyers consider energy-service contracts, leases, or power purchase agreements (PPAs) as alternatives to traditional ownership. Each path has its own implications for ownership, warranties, and maintenance responsibilities. The Solar Panel FAQ approach is to compare offers side-by-side, including the after-incentive cost, expected yearly production, and how credits are applied, before deciding which route best aligns with your budget and goals.
Maintenance and Longevity: What It Means for Payback
Solar panels themselves typically carry long lifespans, commonly 25–30 years, with minimal performance loss over time. Inverters and electrical components may require replacement halfway through a system’s life, adding occasional maintenance costs. Regular cleaning, inspections, and system health checks help preserve output and maintain the expected payback trajectory. Insurance and warranty coverage can also affect long-term ROI. By budgeting for routine maintenance and keeping up with technology upgrades, homeowners can protect the integrity of their investment and more accurately gauge the payback window over the system’s lifetime.
Practical Steps to Improve Payback
To optimize payback, start with a realistic plan for your home energy use. Steps include:
- Align system size with actual usage to avoid oversizing.
- Improve home energy efficiency to raise the value of generation.
- Choose a reputable installer with strong warranties and good monitoring tools.
- Compare offers and incentives from multiple providers to maximize net savings.
- Monitor shading and roof condition to preserve production over time.
These practical actions help shorten payback and maximize the lifetime benefits of solar.