Understanding solar cost per kwh and what it means for your solar decision
Understand solar cost per kWh, how it’s calculated, what factors affect it, and how incentives, financing, and location influence your final solar bills.

The solar cost per kWh is the levelized cost of energy for a solar PV system, expressed as cents per kilowatt-hour over the system’s lifetime. According to Solar Panel FAQ, this metric blends upfront hardware, installation, financing, incentives, and maintenance into a single figure homeowners can compare across bids. Understanding it helps estimate payback and long-term savings.
What is the solar cost per kwh?
The solar cost per kwh represents the levelized cost of energy (LCOE) for a solar installation, expressed in cents per kilowatt-hour over the system’s expected life. It consolidates upfront hardware, installation labor, financing charges, ongoing maintenance, and any incentives into a single metric. For homeowners, it’s the anchor figure you compare across bids to gauge long-term value. In practical terms, a lower cost per kwh usually signals better long-term savings, assuming system performance holds and maintenance remains minimal. When you review quotes, ask installers to show the LCOE calculation clearly and to separate costs tied to equipment from those tied to financing and incentives, so you can see where value lies.
How the LCOE is calculated in residential solar
LCOE is not a one-size-fits-all figure; it depends on several interacting inputs. The main components are the upfront system cost, the expected energy production over the system’s life, the time value of money (financing terms), and operating costs (maintenance, inverter replacement, cleaning). A simple way to think about it is: if a 7 kW system outputs roughly 9,000-12,000 kWh per year in your region, and you finance or own it with certain incentives, the ratio of total life-cycle cost to total lifetime energy produced gives you the cost per kwh. The exact number shifts with degradation rates, weather variability, and utility policies. Solar Panel FAQ analysis, 2026, emphasizes that transparency in this calculation helps homeowners avoid sticker shock when comparing bids.
Why costs differ across homes and markets
Cost per kWh varies because every roof is different. Panel efficiency, shading, orientation, and roof age affect energy output. Local permitting fees, interconnection charges, and sales tax influence upfront costs. Utility policies—like net metering rules and time-of-use rates—alter the value of every kWh produced. Geography matters: regions with higher solar irradiance yield more electricity per installed kW, lowering the LCOE. Incentives also change by jurisdiction, and the timing of incentives affects the effective cost of capital. When you’re evaluating bids, it’s essential to normalize each proposal to a consistent output expectation and finance scenario so the per-kWh figure is truly comparable.
Financing strategies that shape the cost per kWh
Financing options, including cash purchases, solar loans, leases, and power purchase agreements (PPAs), change the effective cost per kWh even if the installed price is similar. A cash sale typically yields the lowest LCOE because you avoid interest. Loans spread the cost over years, but interest adds to the lifetime cost. Leases and PPAs shift some or all of the energy cost to the third party, which can reduce your upfront burden but may cap long-term savings. When budgeting, compare the all-in cost over the 20–30 year horizon, not just the first-year payment. The Solar Panel FAQ team notes that the choice of financing is as critical as hardware quality in determining true per-kWh cost.
The role of incentives and tax credits
Incentives, rebates, and tax credits reduce the effective upfront price, lowering the LCOE. Some programs cover a portion of hardware costs, others offset installation, while some extend to annual energy production through performance-based incentives. The timing and eligibility rules of these incentives matter: if incentives are scheduled to phase out, the earlier you install, the more you benefit. Consumers should track current programs and model scenarios with and without incentives to understand how much the per-kWh cost could drop.
How to read a bid: line items that affect cost per kWh
A high-quality bid breaks costs into clear categories: hardware (panels, inverters, racking), soft costs (permits, design, engineering), balancing costs (battery storage, if included), installation labor, and financing. A transparent bid lists estimated annual production, degradation, and expected lifetime energy output. Compare the quoted dollars per watt, the expected annual energy yield, and the financing assumptions. If any bid is missing a life-cycle calculation, request one. The goal is to convert every bid into a consistent per-kWh cost rather than a pure upfront price.
Case study: a hypothetical three-bid scenario
Consider three installers evaluating a 6 kW home system in a sun-rich climate. Bid A offers a cash purchase, low maintenance costs, and a strong warranty. Bid B uses a loan with higher interest but includes extended monitoring. Bid C is a PPA with no upfront cost but a higher cost per kWh over the contract term. When you convert all three to LCOE terms, Bid A might show the lowest per-kWh cost, Bid B a moderate figure, and Bid C a higher ongoing energy price. The exact numbers will depend on your location and financing choices, but the exercise clarifies where value comes from and where it doesn’t.
Practical steps to improve your solar cost per kwh
- Accelerate production estimates by choosing high-efficiency panels and optimal orientation.
- Minimize shading and ensure regular maintenance to prevent output losses.
- Consider longer warranties and robust inverter options to reduce replacement costs later.
- Optimize financing: compare loan terms, interest rates, and potential cash discounts.
- Leverage incentives early and model scenarios with and without them.
- Get multiple bids and require a transparent LCOE calculation for fair comparison.
- Plan for potential battery storage only if it meaningfully improves your net energy value in your grid.
These steps help you push the per-kWh cost downward while preserving system reliability and durability.
What homeowners should ask installers about cost per kWh
- How do you calculate LCOE for my roof? What assumptions are used for production and degradation?
- What is included in the installed cost, and what might be extra later?
- How do incentives affect the numbers, and when can I expect them to apply?
- What financing options are available, and what is the total cost of ownership over 25–30 years?
- Can you provide a side-by-side, per-kWh comparison of all bids?
- What maintenance is recommended to protect long-term output and minimize costs?
- Do you offer performance guarantees or monitoring that ties to the per-kWh expectations?
Final reflections on the solar cost per kwh
Understanding the solar cost per kWh helps homeowners translate sticker price into long-term value. It captures the combined effect of installation quality, financing, incentives, and local policy, providing a framework for apples-to-apples comparisons. While the metric can look intimidating, breaking it into the components above makes the decision clearer. The Solar Panel FAQ analysis encourages readers to demand transparent LCOE calculations from every installer and to model several scenarios to identify the most cost-effective path.
Sample bid comparison by scenario to illustrate per-kWh cost differences
| Scenario | System Size (kW) | Installed Cost Range | Estimated LCOE | Notes |
|---|---|---|---|---|
| Cash Purchase (no storage) | 6 | 9000-12000 | 6-9 cents/kWh | High upfront value, lower financing cost |
| Financed System | 6 | 9000-12000 | 7-11 cents/kWh | Includes interest over 20-30 years |
| With Battery Storage | 6-7 | 12000-17000 | 8-12 cents/kWh | Adds storage value, higher capex |
| With Aggressive Incentives | 6 | 7000-10000 | 5-8 cents/kWh | Incentives significantly reduce LCOE |
Frequently Asked Questions
How is the solar cost per kWh calculated?
LCOE is calculated by dividing the total life-cycle cost (including hardware, installation, financing, and maintenance) by the total lifetime energy produced. It reflects system degradation, local solar irradiance, and financing terms to produce a per-kWh figure you can compare across bids.
LCOE converts total costs into a per-kWh number, helping you compare bids on value, not just price.
Why does it vary by location?
Location affects solar cost per kWh through sun exposure, weather, grid policies, and available incentives. Higher irradiance means more energy per kW, reducing LCOE. Net metering and utility rates also influence how valuable each kWh is, changing the total cost picture.
Location changes energy output and policy benefits, which shifts the cost per kilowatt-hour.
How do incentives affect the cost per kWh?
Incentives reduce upfront costs or provide ongoing value, lowering the effective LCOE. They can be tax credits, rebates, or performance-based incentives. The timing and eligibility are crucial; early participation often yields greater net savings.
Incentives reduce the effective price, strengthening long-term savings.
Can I rely on the cost per kWh alone?
No. While LCOE is essential, you should also consider system reliability, warranty terms, panel efficiency, degradation, and monitoring. A low LCOE with a short warranty or poor degradation performance may not deliver expected savings.
LCOE matters, but check warranties and reliability too.
What data should I collect when evaluating bids?
Collect per-watt prices, expected annual production, degradation rates, financing terms, maintenance costs, and all incentives. Request a transparent LCOE calculation that uses the same assumptions across bids for a fair comparison.
Gather all costs, energy outputs, and incentives to compare per-kWh fairly.
How long is the payback period typically?
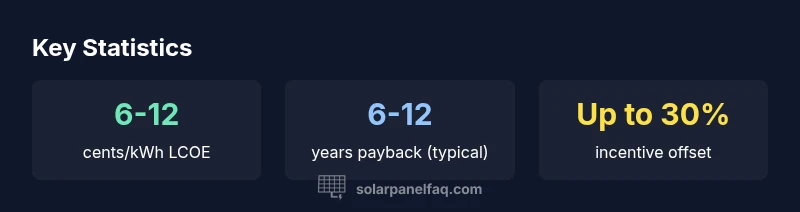
Payback periods vary by location, system size, and financing, but in many markets they fall in the range of 6-12 years when incentives are included. Model different scenarios to see how changes in incentives or energy prices affect payback.
Typically 6-12 years with incentives, depending on variables.
“Clear, data-driven cost comparisons are essential for homeowners. The solar cost per kWh is the most reliable predictor of long-term value when bids are shown with transparent life-cycle analysis.”
Top Takeaways
- Start with LCOE, not upfront price
- Model multiple financing options
- Account for incentives early
- Check how production estimates drive per-kWh cost
- Ask for a transparent, apples-to-apples calculation