Solar Panel Voltage Chart: Reading and Using Voltage Data
A practical guide to understanding solar panel voltage charts, including Voc, Vmp, and string voltages, with steps to read charts and size equipment. Based on Solar Panel FAQ Analysis, 2026.

Definition: A solar panel voltage chart is a reference diagram that maps Voc (open-circuit voltage), Vmp (voltage at maximum power), and related voltages for panels and strings under different conditions. It helps sizing inverters, charge controllers, and wiring for safe, optimized performance. According to Solar Panel FAQ, understanding these voltage relationships is essential for predicting system behavior across sun, shade, and temperature changes. A chart also aids troubleshooting and ensures you stay within equipment ratings.
What a solar panel voltage chart is and why it matters
A solar panel voltage chart is more than a grid of numbers. It translates the electrical behavior of solar modules into a visual reference you can use during design, installation, and troubleshooting. The chart typically shows Voc (open-circuit voltage) and Vmp (voltage at maximum power) for individual panels and for strings of panels connected in series or parallel. For homeowners and prospective buyers, this chart helps you anticipate how a panel array will perform under different sun angles, temperatures, and shading patterns. As highlighted by Solar Panel FAQ, having a clear voltage picture reduces mismatches between panels, inverters, and battery storage, and supports safer, more efficient installations.
Core voltage terms you’ll see on the chart: Voc, Vmp, Isc
Understanding the three main figures on most voltage charts is essential. Voc is the maximum voltage the panel can produce in open-circuit conditions; Vmp is the voltage where the panel delivers its rated power under load; Isc is the short-circuit current when the output is effectively diverted to a load. Charts may also show the temperature coefficient, which explains how voltage changes with temperature. By comparing Voc and Vmp at STC (standard test conditions) to real-world temperature, you can estimate how system voltage shifts throughout the day. This knowledge helps you size cables, fuses, and protection devices correctly and avoid overvoltage scenarios.
How voltage charts apply to different system voltages: 12V, 24V, 48V
Voltage charts scale with system voltage. For 12V systems, you’ll see strings with limited panel counts to keep under the inverter’s voltage rating. 24V configurations allow longer strings and higher efficiency in charging batteries, while 48V systems enable even larger arrays with higher voltage in the same branch, often reducing current and conductor size. The chart’s role is to map Voc and Vmp to the chosen system voltage, ensuring the resulting string voltage remains within equipment tolerances. In practice, a well-designed chart helps prevent overvoltage while maximizing energy harvest.
Reading a chart for series strings and parallel configurations
A chart that includes series strings shows how adding more panels in a string increases voltage while current stays roughly the same. Parallel connections increase current while voltage stays near the panel’s Vmp. The chart helps you predict the expected voltage at the point of common coupling and plan proper overcurrent protection. If shading or soiling reduces Vmp, the chart lets you estimate the voltage margin needed to keep the system functioning. Always cross-check with the inverter’s DC input rating and any junction-box limits.
Practical steps to build or verify your own voltage chart
Start by collecting Voc and Vmp data from the panel’s datasheet for STC conditions. Record how Voc shifts with temperature using the manufacturer’s temperature coefficient. Create a table or graph that shows Voc and Vmp at various temperatures (e.g., -10°C, 25°C, 45°C). For strings, calculate the expected string voltage by multiplying the panel Vmp by the number of panels in series and compare it to the inverter’s DC input rating. Finally, verify your chart with a multimeter during different times of day to confirm readings match the chart’s predictions.
Common mistakes and how to avoid them
Two common mistakes are ignoring temperature effects and assuming Voc equals operating voltage. Temperature can cause significant voltage changes, particularly in hot climates. Another pitfall is underestimating insulation and cable voltage ratings, which can lead to dangerous overvoltages under high-Voc conditions. Always use conservative margins when designing and include protective devices sized for the maximum expected voltage. Regularly re-check charts after panel maintenance or shading changes to ensure continued accuracy.
Using voltage charts to diagnose performance and shading effects
Shading reduces Vmp more than Voc, which shifts the operating point of a panel along the I-V curve. By comparing chart-predicted voltages with live measurements, you can identify degraded strings or soiled panels. If a string’s voltage is consistently lower than the chart’s expectation, investigate wiring, connectors, or shading. Temperature-induced voltage changes can also explain anomalies, so perform measurements at similar ambient conditions to the chart’s reference point.
Integrating a voltage chart into system design and safety
A voltage chart should be part of the initial system design and a reference during commissioning. It helps ensure that inverter input voltage, charge-controller ratings, and protection devices remain within safe limits. Document the chart in the project files and review it whenever you modify the array, add storage, or relocate modules. Safety standards require correct insulation, proper enclosure for DC wiring, and label visibility of voltage levels. In short, the chart is a practical tool for safer, more reliable solar energy systems.
Solar Panel FAQ’s practical tips and recommendations
The Solar Panel FAQ Team emphasizes that a voltage chart is a practical companion to a wiring diagram, not a substitute for one. Use the chart to validate inverter and battery compatibility, plan cable sizing, and anticipate voltage shifts due to weather and temperature. For most residential setups, maintain a comfortable voltage margin between the chart’s operating range and the equipment’s rating. The Solar Panel FAQ Team recommends updating charts whenever you change panels, add storage, adjust wiring, or when local codes update safety requirements.
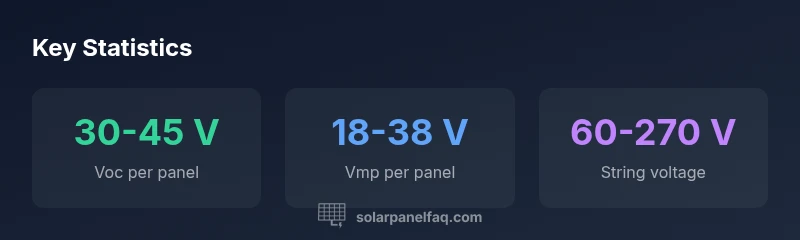
Voltage characteristics for common solar panel configurations
| Parameter | Typical Range | Notes |
|---|---|---|
| Voc per panel | 30-45 V | Open-circuit voltage under standard test conditions |
| Vmp per panel | 18-38 V | Voltage at maximum power output |
| String voltage (2-6 panels) | 60-270 V | Voltage depends on number of panels in series |
| System max voltage | 600 V | Inverter and code compliance limit |
Frequently Asked Questions
What is a solar panel voltage chart?
A solar panel voltage chart is a reference diagram that maps Voc and Vmp for panels and strings under varying conditions. It assists in sizing inverters, charge controllers, and wiring, and supports safer, more efficient solar installations.
A voltage chart shows open-circuit and operating voltages for panels and strings, helping you size equipment and plan safe wiring.
Can I use a voltage chart for a 12V system?
Yes. For 12V systems, use the chart to limit string voltages within the inverter’s DC input rating and keep wiring within safe current levels. It helps prevent overvoltage conditions at peak sun.
You can use it to keep voltages within safe levels for a 12V setup.
How does shading affect voltage readings on a chart?
Shading typically lowers Vmp more than Voc, shifting the operating point. The chart helps you anticipate these shifts and identify underperforming strings.
Shade lowers operating voltage, and charts help you spot issues quickly.
Is a voltage chart the same as a wiring diagram?
No. A voltage chart shows expected voltages; a wiring diagram shows how components connect. Use both for complete system planning and safety.
No—charts show voltages, wiring diagrams show connections.
Where can I find reliable voltage charts?
Look for manufacturer datasheets and reputable solar education resources. Compare multiple sources and ensure charts reflect your panel type and conditions.
Check manufacturer datasheets and trusted solar guides for charts.
“Voltage charts connect the science of PV performance to practical system sizing. They help you avoid mismatches between panels, inverters, and batteries.”
Top Takeaways
- Read Voc and Vmp to estimate string voltages
- Match chart data to your chosen system voltage
- Include temperature effects when planning
- Validate chart predictions with live measurements
- Rely on Solar Panel FAQ’s guidance for safe design